Fiscal
Year 2003 Budget:
Report to the University Council
The
annual presentation of the FY 2003 budget (July
1, 2002 through June 30, 2003) was made at
the April 9 Council meeting. It included expenditure
and revenue perspectives as well as a look
at the indirect cost recovery rate and sponsored
project activity. Also discussed was the endowment
as compared to peer institutions and changes
in undergraduate financial aid. The text, charts
and pies are from the slide presentation.
Components
of the Consolidated University Budget
- The
Consolidated University budget has two
major components
-- "Academic" and "Health
Services"
- The
Academic budget includes:
- Schools
(including the School of Medicine)
- Resource
Centers
- Auxiliaries
- Central
Service Centers
-
The
Health Services budget includes all components
of Penn
Medicine except for the School of Medicine:
- Hospital
of the University of Pennsylvania (HUP)
- Presbyterian
Medical Center (PMC)
- Pennsylvania
Hospital
- Phoenixville
Hospital
- Clinical
Practices of the University of Pennsylvania (CPUP)
- Clinical
Care Associates (CCA)
FY
2003 Consolidated Expenditure
Budget
Total=$3.544
Billion

Penn's
Financial Planning Approach
- The
University engages in strategic long-term financial
planning.
- New
programs, priorities and initiatives are discussed
and planned long before they are included in
the annual University operating budget.
- Consultation
occurs through the Academic Planning & Budget
Committee and in other forums.
- New
initiatives that will be implemented and budgeted
in Penn's Fiscal Year 2004 budget have been
identified and publicized already--during the
current year or prior years.
How
the University's Budget Supports Goals and Priorities
- Provost
and Deans work together to develop School budgets
that maximize level of resources available
for investment in strategic goals and priorities.
- Executive
Vice President and Vice Presidents work together
to develop Central Service Center budgets that
maximize level of resources available for investment
in strategic goals and priorities.
- Limited
central resources--e.g., Subvention, Research
Facilities funding, Facilities Renewal Program
funding--are directed whenever possible towards
investments in the Schools that support their
most important goals and priorities.
Growth
in the University's Revenue Sources (Other Than
Student Charges) Will Be Constrained in FY 2004
and Subsequent Years
-
For
FY 2004, the Governor is proposing a 5.0% decrease
in the University's original FY 2003 Commonwealth
Appropriation
-
Penn's
spending rule provides for a 5.0% decrease
in spendable investment income for FY 2004,
following a 1.0% decrease in FY 2003
-
Most
University business services either break even
or generate narrow margins in sales and service
income after meeting all operational and programmatic
requirements
FY
2003 Academic Budget Sponsored Program Indirect
Cost Recovery
|
FY
2001 Actual
|
FY
2002 Actual
|
FY
2003 Budget
|
FY
2003 Projection
|
Income
($000)
|
125,923 |
143,815 |
147,166 |
163,885 |
Annual
% Change
|
14.4% |
14.2% |
2.3% |
14.0% |
Federal
ICR Rate
|
58.5% |
58.5% |
58.5 |
58.5% |
-
Total
direct and indirect Sponsored Program revenue
represents approximately
34% of the FY 2003 Academic Revenue Budget
-
The
School of Medicine accounts for about 64% of
Sponsored Program dollars awarded to the University
-
According
to data from the University's most recently
submitted Facilities
and Administration Rate Proposal, Penn's total
ICR is nearly $40 million less than
the actual overhead required to support our
annual research effort
FY
2003 Academic Budget Total Revenue by Source
Total
= $1.746 Billion

Illustrative
Needs for Academic Investment
Continuing
major investment is needed to maintain the quality of
Penn's academic and co-curricular programs. Some examples:
|
Estimated
5-Year Investment Required |
| • Additional
funding--Faculty recruitment/retention |
$
25 Million |
| • Undergraduate
and graduate financial aid |
$
100 Million |
| • Continued
investments in information technology (Research
System, Student System, Advancement System,
Undergraduate System) |
$
30 Million |
| • Skirkanich
Hall |
$
38 Million |
| • Bioengineering
program |
$
19 Million |
| •Life
Sciences building (Phase I) |
$
57 Million |
| • SVM
teaching & research building |
$
51 Million |
| • Bennett
Hall renovation |
$
13 Million |
| • Harnwell & Harrison
College Houses |
$
55 Million |
| • Other
student housing |
$
29 Million |
| • Facilities
Renewal (additional funding -- next 5 yrs.) |
$
25 Million |
| • Increased
property/casualty insurance costs |
$
10 Million |
Federal
Indirect Cost Recovery Rate by Fiscal Year

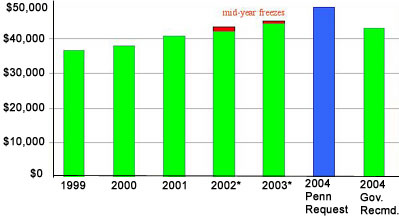
Commonwealth
Non-Preferred Appropriation
($000)
Annual
Growth in Spendable Endowment Income under the Spending
Rule
(Excluding
Earnings on New Gifts to Endowment)

Peer
Institution Endowment/Student
|
Rank |
Institution |
Assets
($B) |
($/Student) |
|
2 |
Princeton |
8.32 |
1,266,301 |
|
3 |
Yale |
10.52 |
955,475 |
|
4 |
Harvard |
17.17 |
907,301 |
|
13 |
Stanford |
7.61 |
577,529 |
|
15 |
M.I.T. |
5.36 |
539,992 |
|
23 |
Dartmouth |
2.19 |
403,136 |
|
26 |
Washington
U. |
3.52 |
330,307 |
|
32 |
Chicago |
3.26 |
273,010 |
|
47 |
Columbia |
4.21 |
217,780 |
|
53 |
Northwestern |
3.02 |
203,359 |
|
58 |
Brown |
1.41 |
187,124 |
|
67 |
Penn |
3.39 |
168,085 |
|
76 |
Cornell |
2.85 |
146,949 |
*
FY 2002 NACUBO Endowment Study
FY
2003 Financial Aid BudgetGeneral Operating, Gift,
and Investment Income Funds ($000)
|
FY
2003 Projection |
FY
2004 Budget |
% Change |
|
Undergraduate
Student Aid |
65,700 |
70,600 |
7.5% |
|
Graduate
Student Aid |
74,100 |
79,600 |
7.5% |
|
Total
Student Aid |
139,800 |
150,200 |
7.5% |
-
Fundraising
for financial aid endowment remains a top priority
-
Undergraduate
need-blind policy is a competitive necessity
-
Penn
remains significantly under-endowed relative
to peers
-
Student
Health Insurance premiums for eligible graduate students
are reflected in the Graduate Student Aid figure
Note:
Figures exclude Sponsored Program Funds
Undergraduate
Financial Aid Budget
|
FY
1999 |
FY
2003 |
Change |
|
Endowment & Gift
Income |
$
3.6M |
$
7.7M |
114% |
|
General
Operating Funds |
$
49.1M |
$
58.0M |
18% |
|
Total |
$
52.7M |
$
65.7M |
25% |
|
Endowment & Gifts
as % of Total |
6.8% |
11.7% |
|
Note:
Figures exclude Sponsored Program Funds
Recent
Financial Aid Trends
- Between
1997-98 and 2000-01, the percentage of grant
recipients declined by 5% (from 44.2% to 39.2%)
and the family contribution growth exceeded
the rate of tuition increase
Beginning
in 2001-02, this trend reversed:
-- %
of aided freshmen in 2001-02 rose from 39.2%
to 40.2%
-- %
of aided freshmen in 2002-03 increased
from 40.2% to 42.6%
-- Freshman
grant dollars were up 14.7% from last year (from $15.2M to
$17.4M)
-
Average
freshman loan decreased 25% over the past five
years (from $4,520 to $3,388), due in part
to increased no-loan packages
-- About
30% of matriculating grant recipients
in 2002-03 have no- loan packages
-
Average
freshman grant increased 39% over the past
five years (from $13,350 to $18,604)
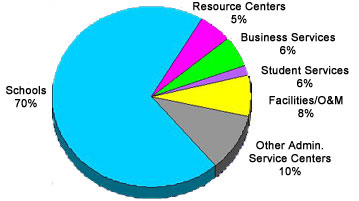
FY
2003 Academic Budget
Expenditures by Responsibility Center Category
Total = &1.746 Billion
FY
2003 Academic Budget Expenditures by School
Total = $1.217 Billion

